Table of Contents
Introduction
Key Observations
Survey Participation
Overall Results
Question 1 – Welcome and Induction (Organisation and Management)
Question 2 – Community and Belonging
Question 3 – Curriculum
Question 4 – Learning and Teaching Delivery, Assessment and Feedback
Question 5 – Resources, Environment and Technology
Question 6 – Your Curriculum Staff
Question 7 – Your Professional Services Staff
Question 8 – Support and Guidance
Question 9 – Barriers for Learning
Question 10 – Course Selection
Question 11 – “One thing”
Overall Curriculum Comparison ratings Questions 1 to 8
Overall Curriculum Comparison – Participation versus Overall Satisfaction
Your Induction
Download Report as PDF
Introduction
This is a high-level report detailing the overall satisfaction per curriculum area.
For a fifth consecutive year the Dumfries and Galloway College Early Experience Student Survey was issued by the Performance Team to ascertain levels of student satisfaction. The survey was open for two working weeks from 14th September to 25th September 2026 and could be accessed by students via a link on LearnNet/Student Portal and was hosted in a Wufoo Survey. Digital screens displaying a QR code were also utilised to promote the survey. Personal Tutors were asked to promote and encourage engagement with the survey. The Admissions team included the survey in their September Purlos Campaign.
Students were invited to rate their satisfaction from 1 star (very poor) to 5 stars (great), and where applicable provide comment. The questions sought feedback in each of the following areas:
- Welcome and Induction (Organisation and Management)
- Community and Belonging
- Curriculum
- Learning and Teaching Delivery, Assessment and Feedback
- Resources, Environment and Technology
- Our Curriculum Staff
- Our Professional Services Staff
- Support and Guidance
New questions were included to provide additional feedback relating to:
- Barriers for Learning
- Induction
It was highlighted last session that the Early experience survey had coincided with another student survey for the two previous sessions. Both surveys have been combined for session 26-27 to avoid survey fatigue for students. The feedback relating to the Induction process will enable the student journey team to make comparisons to data gathered from previous sessions.
Specific curriculum/support area data, including comments, has been shared with the relevant manager. Action grids have been produced to allow opportunity to feedback on the comments raised, to note any examples of You Said We Did, and to record any cross-college trends.
Key Observations
- 70% of eligible students participated (+3% 25-26)
- Students rated their overall satisfaction 4.6 out of 5 (+0.1, 25-26)
- Analysis of each campus data mirrors the overall satisfaction rate, 4.6 out of 5
- Curriculum areas Business and Computing achieved the highest participation rate of 100% (%)
- Curriculum area Construction achieved the highest participation (quantity)
- Nine Curriculum areas increased their participation rate from the previous session
- The highest participation increase was 29% (Renewable Transport)
- Hairdressing had the highest overall satisfaction rates (4.8)
- Overall satisfaction ratings of 4.5 and above were maintained for all curriculum areas with the exception of Hospitality and Lifeskills, Employability and Pathways (4.4)
- The Curriculum areas of Business and Computing had the highest participation rates (100%) but the second lowest overall satisfaction (4.5)
- 80.2% of students attended Induction
- Less ‘One More Thing’ comments were received in comparison to previous sessions
Survey Participation
Overall participation in the survey was extremely positive with 1210 responses in total. 73% of the total eligible current student population took part.
| Session | 2026–2027 | 2025–2026 | 2024–2025 | 2023–2024 | 2022–2023 |
|---|---|---|---|---|---|
| Responses per session | 1210 | 1252 | 1289 | 1055 | 722 |
| Participation | (73%) | (70%) | (80%) | (65%) | (40.5%) |
Chart of Respondents by Curriculum Area (Quantity)
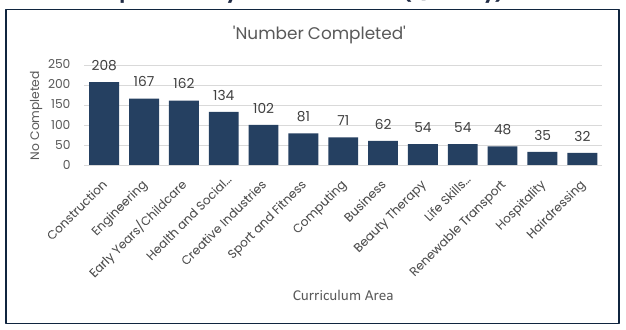
| Curriculum Area | Number Completed |
|---|---|
| Construction | 208 |
| Engineering | 167 |
| Early Years / Childcare | 162 |
| Health and Social Care | 134 |
| Creative Industries | 102 |
| Sport and Fitness | 81 |
| Computing | 71 |
| Business | 62 |
| Beauty Therapy | 54 |
| Life Skills | 54 |
| Renewable Transport | 48 |
| Hospitality | 35 |
| Hairdressing | 32 |
Chart of Respondents by Curriculum Area (%)
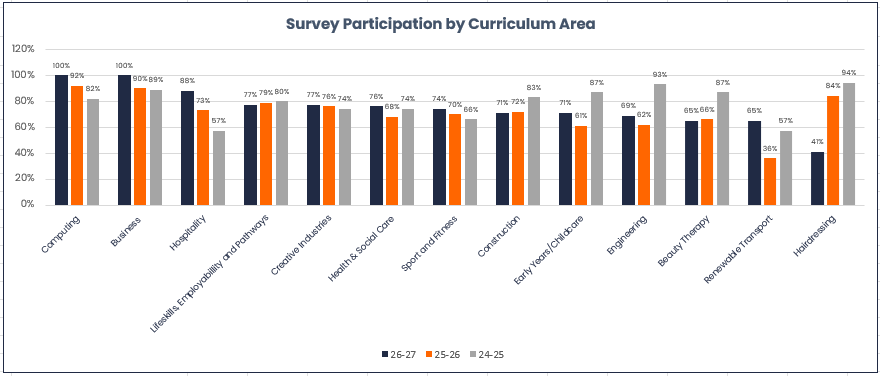
Survey Participation by Curriculum Area
| Curriculum Area | Survey Participation 26/27 | Survey Participation 25/26 | Survey Participation 24/25 |
|---|---|---|---|
| Computing | 100% | 92% | 82% |
| Business | 100% | 90% | 89% |
| Hospitality | 98% | 73% | 57% |
| Lifeskills Employability and Pathways | 77% | 79% | 80% |
| Creative Industries | 77% | 76% | 74% |
| Health and Social Care | 76% | 68% | 74% |
| Sport and Fitness | 74% | 70% | 66% |
| Construction | 71% | 72% | 83% |
| Early Years / Childcare | 71% | 61% | 87% |
| Engineering | 69% | 62% | 93% |
| Beauty Therapy | 65% | 66% | 87% |
| Renewable Transport | 65% | 38% | 57% |
| Hairdressing | 41% | 84% | 94% |
The response rates varied across curriculum teams, with the highest response rates being from Business and Computing (100%). For nine curriculum areas there was an increase in the participation rates in comparison to the previous session.
The most significant participation increase was for Renwable Transport, increasing by 29% from 2025-2026. The other eight curriculum areas noted increases as follows: Hospitality (+15%), Business and Early Years (+10%), Creative Industries and Computing (+8%), Engineering (+7%), Sport and Fitness (+4%) and Health and Social Care (+1%).
A significant participation decrease was noted for Hairdressing (-43%) Particpation for Lifeskills Employability and Pathways, Construction and Beauty Therapy decreased minimally, -2%, -1% and -1% respectively.
Although four curriculum areas noted a decrease in their participation rates in comparison to the previous session, this was an improvement on the eight curriculum areas that noted decreases last session.
Overall Results
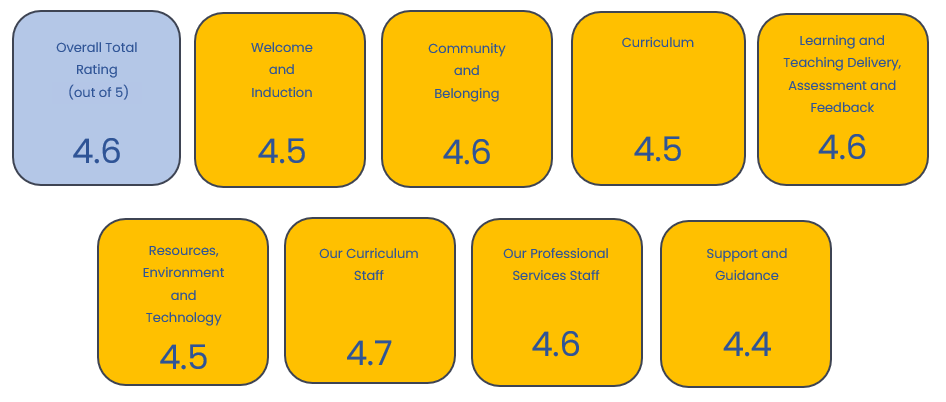
The average overall rating across all 8 questions was 4.6 out of 5, a slight increase (4.5, 25-26) on the rating achieved in the previous session.
Average College rating (out of 5) across all Curriculum areas by Question:
Average Dumfries Campus rating (out of 5) across all Curriculum areas by Question:
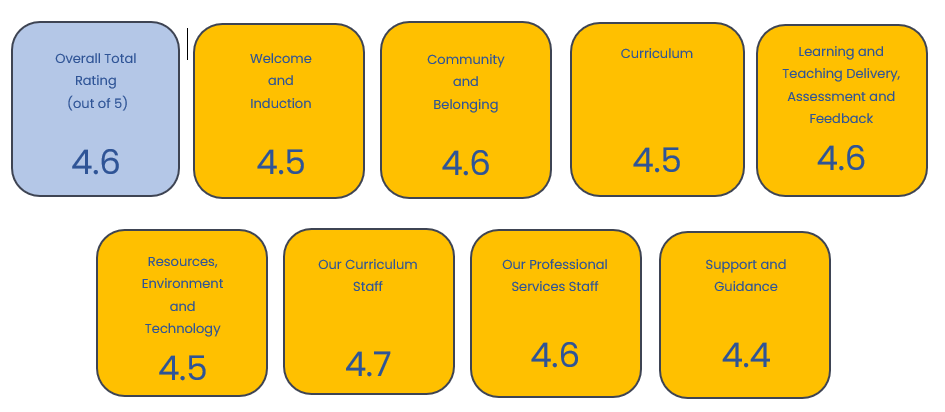
Average Stranraer Campus rating (out of 5) across all Curriculum areas by Question:
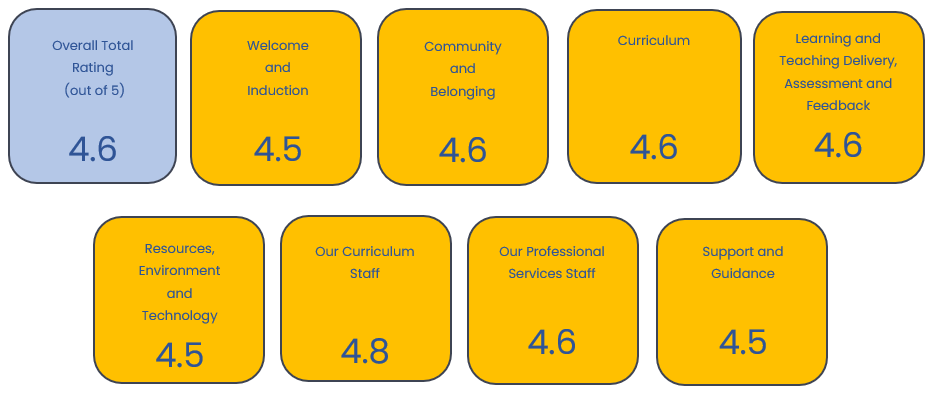
| Survey topic | College | Dumfries | Stranraer |
|---|---|---|---|
| Overall Total Rating (out of 5) | 4.6 | 4.6 | 4.6 |
| Welcome and induction | 4.5 | 4.5 | 4.5 |
| Community and belonging | 4.6 | 4.6 | 4.6 |
| Curriculum | 4.5 | 4.5 | 4.6 |
| Learning, teaching, assessment and feedback | 4.6 | 4.6 | 4.6 |
| Resources, environment and technology | 4.5 | 4.5 | 4.5 |
| Curriculum staff | 4.7 | 4.7 | 4.8 |
| Professional services staff | 4.6 | 4.6 | 4.6 |
| Support and guidance | 4.4 | 4.4 | 4.5 |
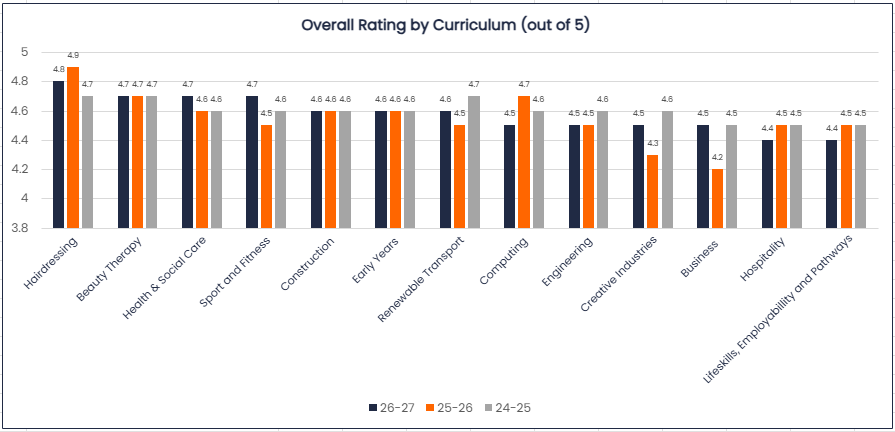
The chart below displays the overall satisfaction rating by Curriculum Areas and by the count of results by each rating (1 to 5):
Overall Rating by Curriculum (out of 5)
| Curriculum Area | 2026–27 | 2025–26 | 2024–25 |
|---|---|---|---|
| Hairdressing | 4.8 | 4.9 | 4.7 |
| Beauty Therapy | 4.7 | 4.7 | 4.7 |
| Health and Social Care | 4.7 | 4.6 | 4.6 |
| Sport and Fitness | 4.7 | 4.5 | 4.6 |
| Construction | 4.6 | 4.6 | 4.6 |
| Early Years | 4.6 | 4.6 | 4.6 |
| Renewable Transport | 4.6 | 4.5 | 4.7 |
| Computing | 4.5 | 4.7 | 4.6 |
| Engineering | 4.5 | 4.5 | 4.5 |
| Creative Industries | 4.5 | 4.3 | 4.6 |
| Business | 4.5 | 4.2 | 4.5 |
| Hospitality | 4.4 | 4.5 | 4.5 |
| Lifeskills, Employability and Pathways | 4.4 | 4.5 | 4.5 |
In comparison to session 25-26, five curriculum areas, Business, Creative Industries, Health and Social Care, Sport and Fitness and Renewable Transport, noted increases (+0.3%, +0.2%, +0.1%, +0.2% and +0.1% respectively) in their overall satisfaction ratings. Four areas maintained the same rating. Four areas noted decreases in the overall satisfaction rating.
As all ratings are 4.4 and above out of 5, we have continued to maintain a high overall rating across all curriculum areas.
Although the Curriculum area of Business had one of the highest participation rates, they had one of the lowest satisfaction rates. Further analysis shows that the overall satisfaction rate of one FE schools group attributed to this.
Results by Question
Question 1 – Welcome and Induction (Organisation and Management)
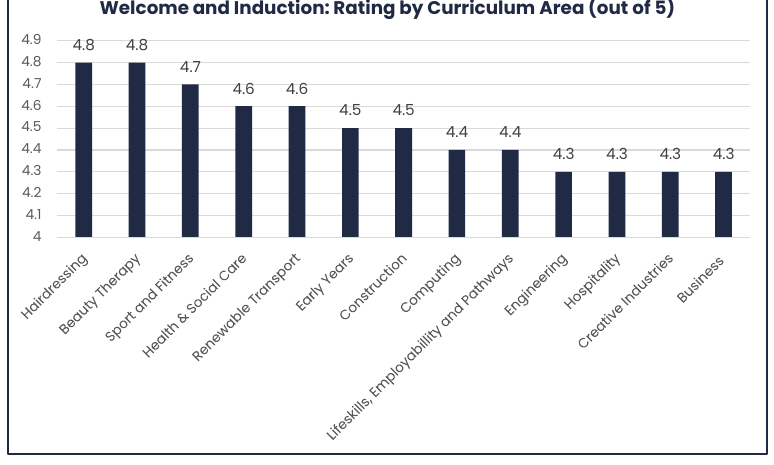
Students were asked – things like welcome activities, clear induction process, pre- course communication, advanced notice of timetable How do you feel about this?
A summary of comments relating to the induction process is provided further on in the report. Please see Induction Question 5.
Welcome and Induction: Rating by Curriculum Area (out of 5)
| Curriculum Area | Rating (out of 5) |
|---|---|
| Hairdressing | 4.8 |
| Beauty Therapy | 4.8 |
| Sport and Fitness | 4.7 |
| Health and Social Care | 4.6 |
| Renewable Transport | 4.6 |
| Early Years | 4.5 |
| Construction | 4.5 |
| Computing | 4.4 |
| Lifeskills, Employability and Pathways | 4.4 |
| Engineering | 4.3 |
| Hospitality | 4.3 |
| Creative Industries | 4.3 |
| Business | 4.3 |
Question 2 – Community and Belonging
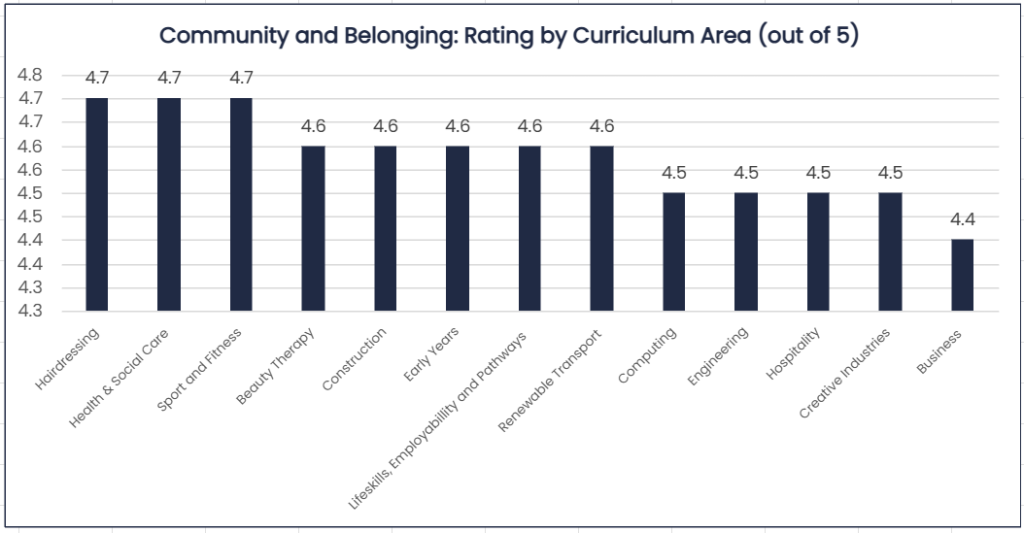
Students were asked – Things like sense of belonging, feeling included, respectful of the diverse community, feeling safe. What is your experience?
The majority of comments referred to sense of community and belonging being very positive, safe and inclusive. A selection of individual comments from the Community and Belonging question are:
A good sense of belonging in college. Respected & feel safe & listened to.
The experience feels pretty fine with everyone I pass by being very friendly and sociable. I also find Dumfries college a very safe place to be at as they have a great way of finding people who don’t belong or shouldn’t be here without their student ID
I have felt included by all lecturers I have encountered at the college so far, everyone is friendly, welcoming, and approachable.
Both my peers and my lecturers are all super welcoming and lovely. Everyone is very accepting and kind.
I have felt very included and reassured during my time at the college, this has helped a lot as I am just beginning education after a while off.
Community and Belonging: Rating by Curriculum Area (out of 5)
| Curriculum Area | Rating (out of 5) |
|---|---|
| Hairdressing | 4.7 |
| Health and Social Care | 4.7 |
| Sport and Fitness | 4.7 |
| Beauty Therapy | 4.6 |
| Construction | 4.6 |
| Early Years | 4.6 |
| Lifeskills, Employability and Pathways | 4.6 |
| Renewable Transport | 4.6 |
| Computing | 4.5 |
| Engineering | 4.5 |
| Hospitality | 4.5 |
| Creative Industries | 4.5 |
| Business | 4.4 |
Question 3 – Curriculum
Students were asked – Things like your course content and structure, relevance, accessible and inclusive classes, your expectations. What is your experience?
The majority of comments noted that students felt their course content was clear, with easily accessible materials. A selection of individual comments from the Curriculum question are:
Excellent course content & structure. Feeling valued & included in & around the classroom.
The course is all very accessible to use at home or when revising.
I am so far enjoying my course content and am comfortable with the workload. LearnNet has been very easy to navigate and any problems I’ve had with teams have been quickly resolved with assistance from my lecturers.
I have really enjoyed the course content so far. The work is interesting and relevant and makes the structure easy to understand. I also feel like classes
are inclusive and that I can get support when needed
My course is very satisfactory, being both challenging and enjoyable to help me learn.
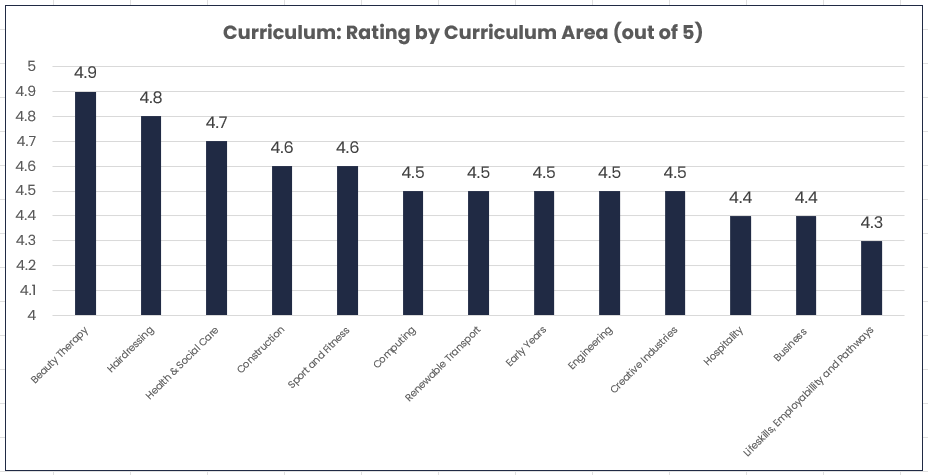
Curriculum: Rating by Curriculum Area (out of 5)
| Curriculum Area | Rating (out of 5) |
|---|---|
| Beauty Therapy | 4.9 |
| Hairdressing | 4.8 |
| Health and Social Care | 4.7 |
| Construction | 4.6 |
| Sport and Fitness | 4.6 |
| Computing | 4.5 |
| Renewable Transport | 4.5 |
| Early Years | 4.5 |
| Engineering | 4.5 |
| Creative Industries | 4.5 |
| Hospitality | 4.4 |
| Business | 4.4 |
| Lifeskills, Employability and Pathways | 4.3 |
Question 4 – Learning and Teaching Delivery, Assessment and Feedback
Students were asked – Things like effective teaching methods, being engaged, interactive, making progress, helpful feedback, assessment support. What is your experience?
The majority noted that teaching methods were effective, engaging with regular feedback provided. A selection of individual comments from the Learning and Teaching Delivery, Assessment and Feedback question are:
I think the staff listen really well to feedback and are very thorough when explaining.
I get explained and taught very well and in a good method with plenty of examples and get asked question about my understanding and I feel like it helps me learn and memorise far better.
All my lecturers have been very friendly, and easy to talk to, give helpful honest feedback so I can improve and I feel I have made good progress
Lecturers are very knowledgeable and are accepting of different students abilities.
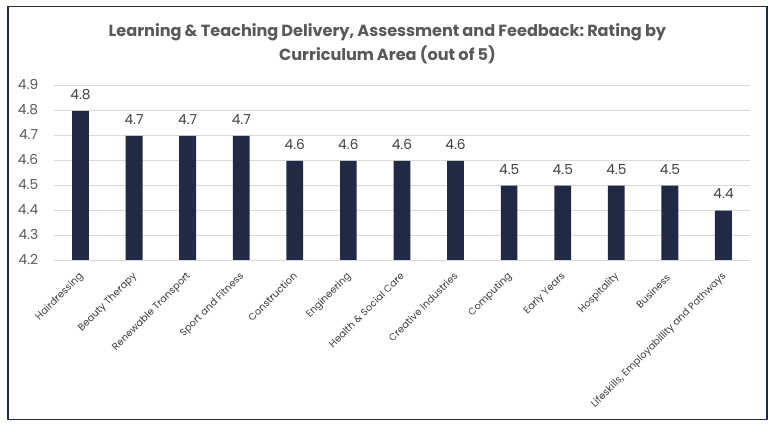
Learning & Teaching Delivery, Assessment and Feedback: Rating by Curriculum Area (out of 5)
| Curriculum Area | Rating (out of 5) |
|---|---|
| Hairdressing | 4.8 |
| Beauty Therapy | 4.7 |
| Renewable Transport | 4.7 |
| Sport and Fitness | 4.7 |
| Construction | 4.6 |
| Engineering | 4.6 |
| Health and Social Care | 4.6 |
| Creative Industries | 4.6 |
| Computing | 4.5 |
| Early Years | 4.5 |
| Hospitality | 4.5 |
| Business | 4.5 |
| Lifeskills, Employability and Pathways | 4.4 |
Question 5 – Resources, Environment and Technology
Students were asked – Things like classrooms, workshops, library, virtual learning environments, individual and group study spaces, physical and digital learning resources. Please tell us about your experience.
Most comments confirmed that our resources, environment and technology are conducive for learning and study. A selection of individual comments from the Resources, Environment and Technology question are:
Great study spaces. The library is amazing.
Great access to the library and learning spaces.
As I’m studying online, I find the digital resources and online learning platform useful and easy enough to access. The course materials are helpful and I like having everything available online.
Great that I can just come in and borrow a laptop when I need it.
I am happy with the learning facilities and resources. The classrooms and digital resources are useful and support my learning. I have access to the resources I need for my course.
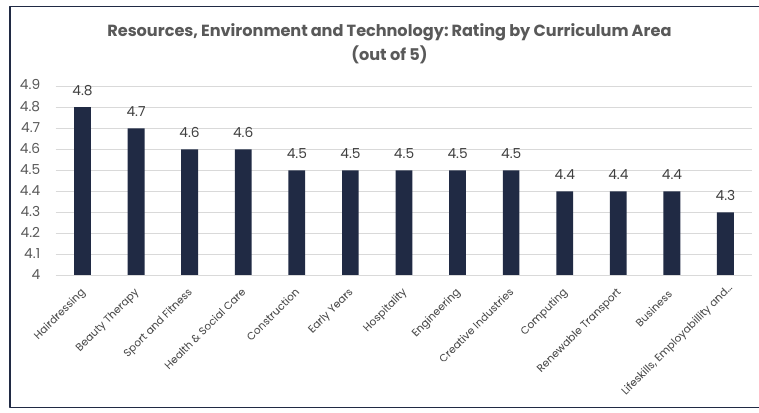
Resources, Environment and Technology: Rating by Curriculum Area (out of 5)
| Curriculum Area | Rating (out of 5) |
|---|---|
| Hairdressing | 4.8 |
| Beauty Therapy | 4.7 |
| Sport and Fitness | 4.6 |
| Health and Social Care | 4.6 |
| Construction | 4.5 |
| Early Years | 4.5 |
| Hospitality | 4.5 |
| Engineering | 4.5 |
| Creative Industries | 4.5 |
| Computing | 4.4 |
| Renewable Transport | 4.4 |
| Business | 4.4 |
| Lifeskills, Employability and Pathways | 4.3 |
Question 6 – Your Curriculum Staff
Students were asked – Things like how helpful and approachable are your Lecturers, Personal Tutor, Curriculum Manager. Do you feel supported by Curriculum Staff? How are we doing?
The majority of comments noted that curriculum staff were approachable and supportive. A selection of individual comments from the Your Curriculum Staff question are:
All of my lecturers are easy to approach and talk to when needed.
I feel comfortable around everyone and feel supported. I know I can ask for help if I am struggling or don’t understand something.
Yes all good I’ve messaged several asking questions and had responses, it’s been easy to communicate.
They are all really supportive and try to explain things by simplifying their language in order for everyone to understand boosting inclusivity.
They are all really supportive and try to explain things by simplifying their language in order for everyone to understand boosting inclusivity.
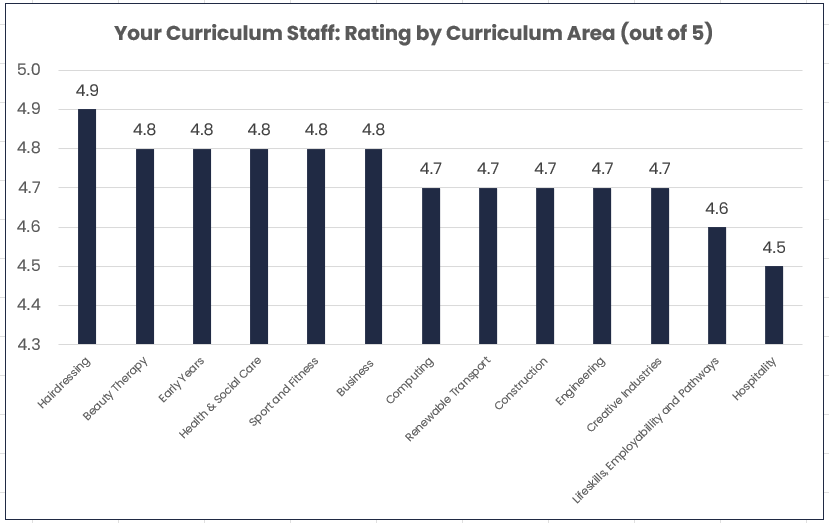
Your Curriculum Staff: Rating by Curriculum Area (out of 5)
| Curriculum Area | Rating (out of 5) |
|---|---|
| Hairdressing | 4.9 |
| Beauty Therapy | 4.8 |
| Early Years | 4.8 |
| Health and Social Care | 4.8 |
| Creative Industries | 4.8 |
| Sport and Fitness | 4.8 |
| Computing | 4.7 |
| Renewable Transport | 4.7 |
| Construction | 4.7 |
| Engineering | 4.7 |
| Business | 4.7 |
| Lifeskills, Employability and Pathways | 4.6 |
| Hospitality | 4.5 |
Question 7 – Your Professional Services Staff
Students were asked – Things like how helpful and approachable are our professional services staff. Do you feel supported as a student and as an individual by our professional services teams? How are we doing?
The majority of comments referred to support staff being helpful, supportive and approachable. A selection of individual comments from the Your Support Staff question are:
I feel really supported and heard, they are very approachable and professional.
Professional Services Staff make me feel very supported and make sure I know I have people to talk to if I’m struggling with anything.
Extra support staff have been a massive help and they are always kind and ready to listen.
I have good support when I have needed it. Everyone I have spoken to has been helpful and explained things to me.
I requested additional support and this was easy to do, and supportive to me.
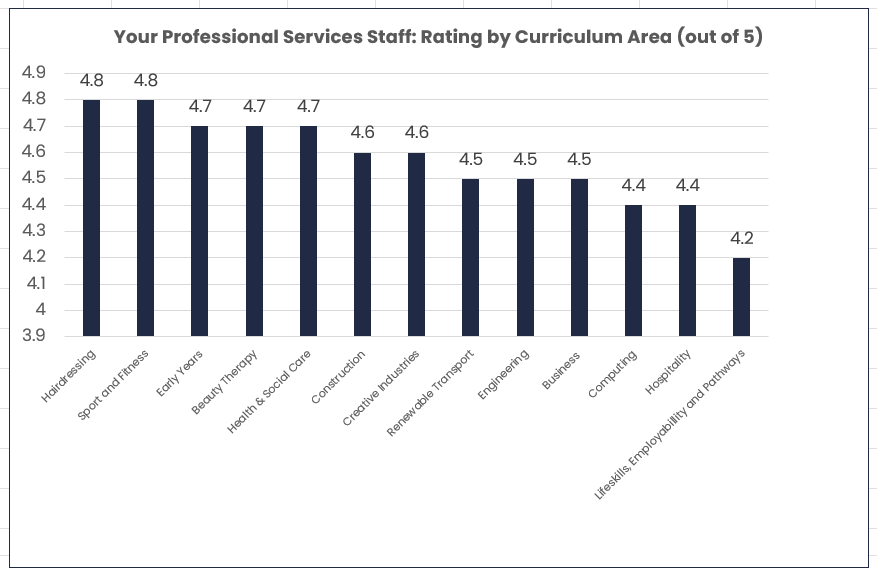
Your Professional Services Staff: Rating by Curriculum Area (out of 5)
| Curriculum Area | Rating (out of 5) |
|---|---|
| Hairdressing | 4.8 |
| Sport and Fitness | 4.8 |
| Early Years | 4.7 |
| Beauty Therapy | 4.7 |
| Health and Social Care | 4.7 |
| Construction | 4.6 |
| Creative Industries | 4.6 |
| Renewable Transport | 4.5 |
| Engineering | 4.5 |
| Business | 4.5 |
| Computing | 4.4 |
| Hospitality | 4.4 |
| Lifeskills, Employability and Pathways | 4.2 |
Question 8 – Support and Guidance
Students were asked – How effective are our specialist professional services such as the application process, enrolment process, onboarding activities funding, student advisors? Do you feel our professional services have enhanced the overall student experience? Please tell us about your experience.
The majority of comments referred to our support services as being really effective and our application process being straightforward. A selection of individual comments from the Support and Guidance question are:
I think they are quite effective and it’s nice to get regular updates through emails within a few weeks advance.
Specialised professional services & student advisors have enhanced my overall student experience.
Yes all have been great! I especially like the WhatsApp communication.
I have found the support and guidance helpful throughout my student experience. The enrolment and other processes were clear, and I felt supported when I needed help. The support has made my experience as a student more positive.
Very straight forward and easy, I enrolled easily and I felt support throughout the process and knew where to go if I had any concerns.
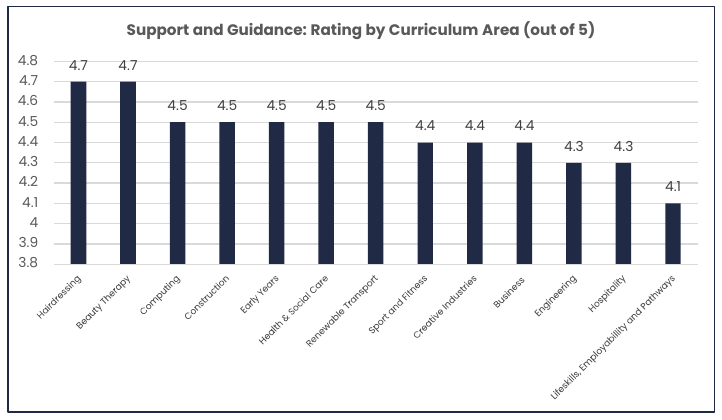
Support and Guidance: Rating by Curriculum Area (out of 5)
| Curriculum Area | Rating (out of 5) |
|---|---|
| Hairdressing | 4.7 |
| Beauty Therapy | 4.7 |
| Computing | 4.5 |
| Construction | 4.5 |
| Early Years | 4.5 |
| Health and Social Care | 4.5 |
| Renewable Transport | 4.5 |
| Sport and Fitness | 4.4 |
| Creative Industries | 4.4 |
| Engineering | 4.4 |
| Business | 4.3 |
| Hospitality | 4.3 |
| Lifeskills, Employability and Pathways | 4.1 |
Question 9 – Barriers for learning
Students were asked – Is there anything practical that could make it difficult for you to attend, participate or continue with your course? The Barrier for learning categories and responses are shown below:
| Barrier | Number of responses | % |
|---|---|---|
| Childcare | 50 | 10.4% |
| Travel | 279 | 58.0% |
| Digital Access | 45 | 9.4% |
| Funding | 107 | 22.2% |
| Total number of responses | 481 |
Question 10 – Course selection
Based on what you know now, do you feel you are on the right course and at the right level?
- 1184 (98.6%) indicated ‘Yes’
- 26 (2.1%) of students indicated ‘No’
Students were asked if anything was different from what they expected.
For the students who indicated they were on the wrong course level, 5 students advised that a higher level would be less repetitive and more challenging, and the remaining students were happy with their choice (1), had since changed their mind on their course of study (1) and were unsure of current course but will continue with their studies (2). For the students who indicated they were on the wrong course level, 17 provided no further comment.
Question 11 – “One thing”
Students were asked – If there is one thing we could do to make your experience at College better what would that be?
A total of 380 students provided a ‘Yes’ response to this question, although 282 indicated ‘Yes’ but did not provide a comment. Feedback from 10 students indicated they had either no suggested improvements, were unsure at this point in time or their college experience had been positive so far. There were 85 comments logged, noting specific areas where we could do better. These are free text responses which have been examined for key themes.
| Session | 26-27 | 25-26 | 24-25 | 23-24 | 22-23 |
|---|---|---|---|---|---|
| Number of comments received | 85 | 319 | 310 | 359 | 217 |
The themes are comparable to the previous sessions, and a summary of the most common themes is provided below:
| Theme | 26-27 | 25-26 | 24-25 | 23-24 | 22-23 |
|---|---|---|---|---|---|
| Catering provision, choice and pricing | 9.4% | 15.1% | 21.9% | 25.6% | 26.7% |
| Curriculum | 51.8% | 42.3% | 50.2% | 43.7% | 34.1% |
| Estates | 8.2% | 12.2% | 5.1% | 10.6% | 13.4% |
| Digital Services | 4.7% | 4.7% | 3.5% | 6.1% | 4.6% |
| Support/Funding | 3.5% | 2.2% | 2.3% | 2.8% | 4.1% |
| Transport | 14.1% | 15.4% | 6.8% | 4.5% | 7.4% |
| On campus activities | 7.1% | 6.0% | 9.3% | 6.1% | 9.7% |
| Other | 1.2% | 2.2% | 1.0% | 0.6% | 0.0% |
There has been a substantial decrease in the number of comments (-234) submitted in relation to ‘one thing we could do better’ in comparison to last session.
A large quantity of the “One thing” comments provided positive feedback and were not related to a particular theme. A sample are provided below:
- Better food options
- Food options in canteen are repetitive on specific days
- Fix the printer issue please, other than that all good.
- More signage on where classrooms are, for example at the start of a hallway there could be a sign saying all of the room numbers down that hallway, (rooms 1-30) for an example
- More than one pool table
- Get more activities to do, more than one pool table.
- Make transport to and from college more accessible to more students especially those from outwith Dumfries
‘One thing’ comments relating to curriculum areas are comparable to the previous sessions and a summary of the most common themes is provided below:
| Theme | 26-27 | 25-26 | 24-25 | 23-24 | 22-23 |
|---|---|---|---|---|---|
| Number of curriculum related comments | 44 | 135 | 156 | 157 | 74 |
| Course content/management | 47.7% | 46.7% | 51.9% | 42% | 59.5% |
| Hybrid learning | 6.8% | 14.1% | 14.7% | 10.8% | 21.6% |
| Rooms/tools/facilities | 31.8% | 20.0% | 14.4% | 23.6% | 6.8% |
| Start times/breaks | 0.0% | 12.6% | 10.3% | 17.8% | 9.5% |
| Support | 13.6% | 6.7% | 8.3% | 5.7% | 2.7% |
| Other | 0.0% | 0.0% | 0.6% | 0% | 0% |
Feedback from curriculum and professional services managers will be gathered as part of the College You Said We Did process.
Overall Curriculum Comparison ratings Questions 1 to 8
| Curriculum Area | Overall Satisfaction (out of 5) | Question 1 | Question 2 | Question 3 | Question 4 | Question 5 | Question 6 | Question 7 | Question 8 |
|---|---|---|---|---|---|---|---|---|---|
| Hairdressing | 4.8 | 4.8 | 4.7 | 4.8 | 4.8 | 4.8 | 4.9 | 4.8 | 4.7 |
| Beauty Therapy | 4.7 | 4.8 | 4.6 | 4.9 | 4.7 | 4.7 | 4.8 | 4.7 | 4.7 |
| Health & Social Care | 4.7 | 4.6 | 4.7 | 4.7 | 4.6 | 4.6 | 4.8 | 4.7 | 4.5 |
| Sport and Fitness | 4.7 | 4.7 | 4.7 | 4.6 | 4.7 | 4.6 | 4.8 | 4.8 | 4.4 |
| Construction | 4.6 | 4.5 | 4.6 | 4.6 | 4.6 | 4.5 | 4.7 | 4.6 | 4.5 |
| Early Years | 4.6 | 4.5 | 4.6 | 4.5 | 4.5 | 4.5 | 4.8 | 4.7 | 4.5 |
| Renewable Transport | 4.6 | 4.6 | 4.6 | 4.5 | 4.7 | 4.4 | 4.7 | 4.5 | 4.5 |
| Business | 4.5 | 4.3 | 4.4 | 4.4 | 4.5 | 4.4 | 4.8 | 4.5 | 4.4 |
| Computing | 4.5 | 4.4 | 4.5 | 4.5 | 4.5 | 4.4 | 4.7 | 4.4 | 4.5 |
| Creative Industries | 4.5 | 4.3 | 4.5 | 4.5 | 4.6 | 4.5 | 4.7 | 4.6 | 4.4 |
| Engineering | 4.5 | 4.3 | 4.5 | 4.5 | 4.6 | 4.5 | 4.7 | 4.5 | 4.3 |
| Hospitality | 4.4 | 4.3 | 4.5 | 4.4 | 4.5 | 4.5 | 4.5 | 4.4 | 4.3 |
| Lifeskills Employability and Pathways | 4.4 | 4.4 | 4.6 | 4.3 | 4.4 | 4.3 | 4.6 | 4.2 | 4.1 |
Overall Curriculum Comparison – Participation versus Overall Satisfaction
| Curriculum Area | Participation (%) | Participation (Number) | Overall Satisfaction (out of 5) |
|---|---|---|---|
| Computing | 100% | 71 | 4.5 |
| Business | 100% | 62 | 4.5 |
| Hospitality | 88% | 35 | 4.4 |
| Lifeskills, Employability and Pathways | 77% | 54 | 4.4 |
| Creative Industries | 77% | 102 | 4.5 |
| Health and Social Care | 76% | 134 | 4.7 |
| Sport and Fitness | 74% | 81 | 4.7 |
| Construction | 71% | 208 | 4.6 |
| Early Years/Childcare | 71% | 162 | 4.6 |
| Engineering | 69% | 167 | 4.5 |
| Beauty Therapy | 65% | 54 | 4.7 |
| Renewable Transport | 65% | 48 | 4.6 |
| Hairdressing | 41% | 32 | 4.8 |
Your Induction
Additional questions relating to Induction were included in the 26-27 survey.
Question 1 – Did you attend your College Induction?
| Attended Induction – Both Campuses | Number of responses | % |
|---|---|---|
| Yes | 971 | 80.2% |
| No | 239 | 19.8% |
| Attended Induction – Dumfries | Number of responses | % |
|---|---|---|
| Yes | 859 | 79.6% |
| No | 220 | 20.4% |
| Attended Induction – Stranraer | Number of responses | % |
|---|---|---|
| Yes | 112 | 85.5% |
| No | 19 | 19.0% |
Question 2 – Following your Induction, do you know where to find important College information?
Students were asked to select all that applied:
| Area | Number of responses | % of Induction attendees |
|---|---|---|
| Student Advisors | 746 | 76.8% |
| Student Funding | 534 | 55.0% |
| Admissions | 464 | 47.8% |
| Student Association | 580 | 59.7% |
| Educational Support | 502 | 51.7% |
| Wellbeing support or counselling | 473 | 48.7% |
| Active Campus | 457 | 47.1% |
| I’m not sure to contact | 134 | 13.8% |
Question 3 – If you needed support, which of the following services would you know to access?
Students were asked to select all that applied:
| Area | Number of responses | % of Induction attendees |
|---|---|---|
| Student Portal | 782 | 80.5% |
| Interactive Student Guide | 309 | 31.8% |
| Student Charter | 228 | 23.5% |
| College Website | 643 | 66.2% |
| Skills Development Scotland | 422 | 43.5% |
| I’m not sure how to find these | 100 | 10.3% |
Question 4 – During your course induction, were you introduced to the following?
Students were asked to select all that applied:
| Area | Number of responses | % of Induction attendees |
|---|---|---|
| Your lecturers and curriculum team | 871 | 89.7% |
| Your Personal Tutor and Tutorial Time | 721 | 74.3% |
| Your timetable | 788 | 81.2% |
| Teaching rooms and facilities | 777 | 80.0% |
| Your course structure and expectations | 758 | 78.1% |
| Assessment and feedback | 629 | 64.8% |
| Academic honesty and related policies | 618 | 63.6% |
| Opportunities to get to know other students | 658 | 67.8% |
Question 5 – Students were asked – Is there anything you wish had been explained better during your Induction?
A total of 37 students provided a response to this question. A selection of the individual comments covered various themes which included:
- information on assessments
- information on placement
- ID cards being available
- Information on timetables
The Performance Team – October 2026
Download as PDF
You can download the full experience student survey report as a PDF below, if you require an alternative accessible format please get in touch via info@dumgal.ac.uk